Overview: What’s required and why
The monitoring solution must gather the metrics you need to diagnose any CPU, memory or I/O issues on your SQL Servers. It should also provide a set of accurate, reliable, configurable alerts that will inform us when jobs fail or fail to run, database or server properties deviate from the established “standard”, there are sustained spikes in resource usage, or abnormal trends, and so on. Why do we need all this monitoring? Two reasons, the first of which is capacity planning. Unless we know the server’s resource limits (storage space, memory, I/O capacity and so on) and monitor current resource usage then we may not find out that we need to increase capacity until one of them “runs out”.
As Rodney Landrum observes in his article, The Strategic Value of Monitoring SQL Servers:
…if you turn up in your boss’s office with the news that “server x requires 2 TB of extra disk space, immediately, due to unexpected growth” then expect his or her first question to be:” Why wasn’t it expected?“
If we have proper monitoring together with reporting and trend analysis, we can see the train crash coming, and “re-route the tracks” to avoid disaster. We can show the boss a report that says “Server x will be out of space or memory in 4 months” and advise them to account for this in the project budget.
The second but equally important element is reaction time. With effective monitoring, alerting and reporting, we can respond to an emergency before too many people are affected, and the crisis escalates.
When an organization under-invests in monitoring, DBAs are obliged to spend much of their time fighting fires. They respond when users complain of slow performance or other system problems. The DBA hunts down the problem by collecting the evidence, using built-in SQL Server resources such as Profiler, PerfMon, Extended Events and the Dynamic Management Views.
A better alternative is to build or buy a monitoring tool that will collect the evidence from these resources, on an ongoing basis, and use it to start looking ahead, as well as back. Using predictive analysis of the monitoring data over time, we can detect looming issues before they become serious problems.
Build versus Buy
As long as the monitoring system works efficiently to give accurate figures for capacity planning, and allows DBA to diagnose and prevent performance problems, it does not matter too much to management whether DBAs design their own monitoring solution, or buy a monitoring tool.
If the monitoring requirement is limited to a single SQL Server, or a very small number of servers, then it’s perfectly feasible to gather the required diagnostic data ‘by hand’, from the system tables, built-in functions, Dynamic Management Objects (DMOs), performance counter values, SQL Server Data Collector and so on. We can script this information using T-SQL or PowerShell. However, even in these cases, we still need to consider how to automate the collection of all the required data, across all servers, likely comprising different versions and editions, as well as the configuration and management of a central location to store and analyze all of this data.
While with the appropriate scripts and tools plus a means to collect data across all servers (such as SSIS), it’s possible that DBAs can build their own “monitoring data warehouses”, most teams will find that the effort to build and maintain such a tool is considerable. As the number of monitored servers grows, there will come a point, quite quickly, where it saves time and resources to use a third-party monitoring tool. It will provide at least 90% of the coverage you need, certainly enough to cover basic server metrics, and performance monitoring metrics, relating disk, I/O and memory usage, as well as monitoring for specific problems such as prolonged blocking, abnormal job duration and so on.
For the rest, most tools will offer a means to add custom monitoring scripts and alerts. Some offer built in data analysis features such as the ability to examine the health and performance of a SQL Server environment at a specific point in the past, or directly compare a certain metric over two periods, for example comparing Tuesday this week with Tuesday last week, or with the averaged data for the previous seven Tuesdays.
This article uses a third party monitoring tool, Red Gate SQL Monitor in one or two of the examples.
Configuring a Monitoring System: Do’s and Don’ts
Regardless of whether we choose to build or buy a monitoring solution, there are a few key factors to consider when setting up and running it.
- Use a separate monitoring server – it’s little help if the monitoring service, responsible for telling you that something’s failed on your server, goes down at the same time as the server. You should also consider monitoring the monitoring service via a simple “ping” from the production server, or perhaps using Policy Based Management (see http://technet.microsoft.com/en-us/library/bb510667.aspx)
- Use a separate monitoring database – monitor its growth and plan for it to grow quite large.
- Choose monitoring intervals carefully – we’ll only need to collect certain server and configuration data once each day, but we’ll need to collect certain performance metrics at much shorter intervals, such as every 5 or 10 minutes. The more frequently you capture the data, the faster the data will grow.
- Purge/Archive Historical Data regularly – decide for how long to keep historical data online. I’d recommend keeping 2-3 months of data online, if possible, as it’s sometimes hard to spot trends over shorter periods. Purge any data older than this date, or migrate the data to a warehouse for longer-term storage and analysis.
- Test your monitoring scripts and queries – these queries will run automatically against all servers and databases on your system so it’s very important to understand exactly what sort of impact it’s likely to have when you run it. It’s common for perfectly benign queries to become resource-hungry monsters when run once against each of a one hundred databases on a server.
- Start small and expand gradually – start with a relatively small set of base alerts, across your servers and databases. Get comfortable with the level of alerting, monitor growth of the central repository to get a feel for how much data you’re collecting, tweak the strategy as appropriate, and, once satisfied, consider expanding.
- Avoid the Observer effect – Don’t go so overboard that the monitoring affects the server. Likewise, be wary of changing options just because they help with the monitoring (such as enabling a trace flag for verbose query output), and make sure any third party solution isn’t doing this either
Step 1: Discover your servers
If you are a new DBA on a SQL Server environment that lacks monitoring, the first step is to automate the process of discovering and adding the SQL servers that you wish to document and monitor. There are several ways to do this, but one possibility, provided free, is the Microsoft Assessment and Planning (MAP) Toolkit. Some of the documentation for the tool reads like an open invitation from Microsoft to decide how much money you’d like to give them (“assess your current IT infrastructure and determine the right Microsoft technologies for your IT needs“). However, it’s a very useful tool during this initial discovery phase, when you’re wondering just how many SQL Servers you need to monitor, and where they are physically located.
If you have a windows network (and hence an AD domain controller), you run the tool as a domain admin and it can tell you exactly what is on your network, including SQL Server, Windows OS, Office installations, Exchange and a whole lot more. It tells you version, edition and patch level for each instance on the network, it can find out if it’s a named or default instance. It can tell you how many processors the machine has, and how much memory.
Another possibility is to use PowerShell to discover and document your servers. For example, see Kendal Van Dyke’s SQL Power Doc tool, based on PowerShell ).
Step 2: Basic Server and Database Documentation
We need solid documentation of all of our servers, instances and databases. This includes documentation and monitoring of database and server configuration settings, in order to assess how closely they adhere to company standards, and the normal default values. If someone enables “Auto Shrink” database option, or turns off “Auto Update Statistics”, we need to know about it. Likewise, if someone changes the SQL Server setting, “Max Server Memory”, we need to know. It also includes security monitoring – in other words, who has access to what and with which permissions.
Examples | Primary Source | Recommended References | |
Server properties | Database edition, version, location, name, size, collation setting etc. | SQL Server Tacklebox (Free ebook), Rodney Landrum
Provides T-SQL scripts to collect all manner of server and database information | |
Database properties | Recovery model, data and log file locations, size and growth settings etc. | (or SYS.SYSFILES) | SQL Server Tacklebox (as above) |
SQL Server Instance-level configuration | Fill factor, max server memory, MAXDOP etc. | How to Document and Configure SQL Server Instance Settings, Brad McGehee Capture the instance data using PowerShell and save it to a CSV file, which can be stored in Source Control to track any changes. | |
Database-level configuration | Auto Shrink, Auto Update Statistics, forced parameterization etc. | Database Properties Health Check, Brad McGehee
| |
Security | Logins, permissions, roles and their members etc. | plus others. | SQL Server Tacklebox (as above) |
Table 1: Basic Server and Database Monitoring
In each case, we then need a method to automate the collection of all of this data, across all servers, and then store it in a central repository, for reporting and analysis. Viable tools include T-SQL and SSIS, PowerShell, and others, as demonstrated in the references in Table 1.
Step 3: Backups and SQL Agent Jobs
For our backups, we need to be sure that all required backups (full and differential database and log backups) are running and the storage location. For our backup jobs, and any other SQL Server Agent jobs we need to monitor:
- Failed jobs
- Jobs of abnormal duration
- Jobs that fail to run – it is often as important to know about jobs that don’t run, as jobs that run but fail
We also need to monitor for any changes in status of core services, such as SQL Server Agent, or even SQL Server itself.
We can get all the basic information we need about our backups and Agent jobs from the appropriate set of systems tables, namely the Backup and Restore tables and the SQL Server Agent tables.
Again, various tools and techniques will allow us to collect this data from each server, for central storage and monitoring. SQL Server Tacklebox (see previous reference) shows how to collect it with T-SQL scripts and SSIS. Again, PowerShell is a powerful alternative; see for example, The PoSh DBA: Solutions using PowerShell and SQL Server.
Step 4: Space and Growth Rates (Capacity Planning)
One of the first metrics that a DBA needs is disk space, and database file sizes (see, for example, Quick PowerShell Disk Space Check). This is popular in those cases where a system administrator needs an alert when disk space reaches a threshold of, say, 90% of disk size, so that there is time to plan to add disk capacity before space runs out and the application errors-out.
For enterprise-scale database systems, this isn’t enough. It isn’t just the bare figures we need, but the trend over time; is growth linear, or exponential? There is little that the DBA can do to control this growth beyond checking that the data-housekeeping routines are effective, but knowledge of the growth trend is essential to make an educated guess as to when extra disk-space needs to be added (see, for example, Monitoring SQL Server Disk Space).
Step 5: CPU, I/O and Memory Monitoring
For resource usage monitoring, we need to track over time:
- Server-wide CPU, I/O and Memory use
- SQL Server specific CPU, I/O and Memory use
- Specific wait statistics and other performance/activity metrics, such as user connections, batch requests/sec and so on.
It is relatively straightforward to collect, manage and monitor the basic server configuration data (Step 2). Unless your DBA team are an especially reckless bunch, the server/database configuration data should not vary too much over time, and we can collect and review the backup/job data daily.
However, it is a much greater task to collect, and manage over time, the basic resource data (CPU, I/O, memory). We need to collect this data from a range of sources, including PerfMon, Dynamic Management Views, and various other system tables and views. Depending on the level of server activity, we may need to collect this data every few minutes so that we have the depth of detail needed to respond to various conditions on our server. These conditions could be either acute or chronic, the former requiring specific and often immediate investigation, and the latter developing gradually, over time.
For many DBAs, it is daunting enough merely to collect the data, let alone analyse all the disparate parts to diagnose the root cause of a problem. I also believe that manual data collection and analysis tends to lead the DBA to a focus on specific metrics rather than the data as a whole. It is rare to be able to pinpoint a problem just by examining a single set of data (I/O data, or CPU data, and so on). For example, many SQL Servers will exhibit signs of what looks like a disk I/O bottleneck but the root cause, in most cases, is not an inadequate or poorly configured disk subsystem but a memory bottleneck in the buffer pool, or excessive index or table scans due to poorly written queries.
It is only by considering the data as a whole that we can make a quick, correct diagnosis. Here, the advantage swings in favor of a third-party monitoring tool, in my opinion. It removes the “heavy-lifting” of data collection and management, and offers guidance on potential performance issues, via an easier, visual way to analyze and correlate memory versus I/O versus CPU usage at any given time, as well as the queries and processes that were active at that time.
This section offers a quick reference for useful resources concerning the sort of resource data we need to collect, followed by a brief example of multi-metric analysis with a monitoring tool (SQL Monitor).
Monitoring Resource Usage with PerfMon
The most popular tool for general server resource monitoring is the Windows monitoring tool Performance Monitor (Perfmon). It is a Windows OS monitoring tool that provides a range of counters for monitoring memory, disk I/O, CPU and network usage on a server (for example, see http://technet.microsoft.com/en-us/library/cc768048.aspx), and also exposes the counters maintained by SQL Server. Generally, the DBA or system administrator sets up Perfmon to record statistics from various counters at regular intervals, storing the data in a file and then importing it into Excel, or a similar tool, for analysis.
There are plenty of available tutorials on the use of Perfmon. In addition to the documentation on TechNet (http://technet.microsoft.com/en-us/library/cc749249.aspx), I recommend, especially, the following:
- SQL Server Perfmon Best Practices, by Brent Ozar
The standard “go to” tutorial on use of the tool, recommended counters for monitoring SQL Server, and how to analyze the saved data in Excel - Free Tools for the DBA: PAL Tool, by Jonathan Kehayias
A “how to” on the Performance Analysis of Logs tool, which simplifies collecting and analyzing sets of Perfmon data - Collecting Performance Data into a SQL Server Table, by Feodor Georgiev
Shows how to collect Perfmon data to a SQL Server table for querying - A Performance Troubleshooting Methodology for SQL Server, by Jonathan Kehayias
A broader piece on assembling the various pieces of the puzzle so that you have a data that will provide a complete understanding of what is going on inside of a server, but with specific coverage of useful Perfmon counters, and how to collect the values from the DMVs
Don’t focus on one counter. Examine values in groups and correlate across groups too and with relevant lower-level metrics, mined from the DMVs (see next section).
Counters | Resource Area | Indicators |
SQLServer:Access Methods\Full Scans/sec SQLServer:Access Methods\Index Searches/sec | IO-related | A healthy ratio is 800-1000 times more index searches than scans (ref: 4, above) but establish what is normal for your system. Missing indexes are a common cause. |
Physical Disk\Avg. Disk Reads/sec Physical Disk\Avg. Disk Writes/sec | IO-related | Latency associated with SQL Server read and write operations will depend on the type and speed of your disks, but commonly-cited guidance values (ref: 4, above) are: Less than 10 ms = good performance Between 10ms and 20 ms = slow performance Between 20ms and 50ms = poor performance Greater than 50ms = significant performance problem |
SQLServer:Buffer Manager\Lazy Writes/sec SQLServer:Buffer Manager\Page life expectancy SQLServer:Buffer Manager\Free list stalls/sec SQL Server:Buffer Manager\ Free Pages SQLServer:Memory Manager\Memory Grants Pending | Memory-related | A set of counters that together may indicate memory pressure. E.g. fluctuating Page Life Expectancy, non-zero Free List Stalls/sec and high Lazy Writes/sec indicates the buffer pool cannot handle the amount of amount of data the workload needs. Solution could be more memory or query tuning or missing indexes. |
SQL Server:Memory Manager\ Target Server Memory(KB) SQL Server:Memory Manager\Total Server Memory (KB) | Memory-related | Amount of memory that SQL Server wants to commit (target) versus total memory allocated. If target>total it could indicate memory pressure – but the SQL Server counters above are better indicators |
Processor/ %Privileged Time Processor/ %User Time Process (sqlservr.exe)/ %Processor Time | CPU-related | What is eating the CPU? Is it SQL Server (%user time) or some other operating system process (% privileged time) |
SQLServer:SQL Statistics/Batch Requests/sec SQLServer:SQL Statistics/SQL Compilations/sec SQLServer:SQL Statistics/SQL Re-Compilations/sec SQLServer:SQL Statistics/Auto-Param Attempts/sec SQLServer:SQL Statistics/Failed Auto-params/sec SQLServer:Plan Cache/Cache hit Ratio | CPU-related | For example, many ad-hoc queries and a general lack of parameterization can cause excessive plan compilation and many auto-parameterization attempts. This is a common cause of many CPU issues. |
Table 2: Useful Perfmon counters
Although Table 2 offers guidelines values in a few cases, you should never use “magic thresholds” or let accepted wisdom dictate “good” and “bad” values for these counters. Instead, establish what is normal for your system in question and investigate further if a certain value falls far outside the normal range.
Diagnosing Resource Bottlenecks with DMVs
As well as general server-level monitoring, you’ll want to mine and track some of the key data held in the various Dynamic Management Views (DMVs), for all user database plus global resources such as tempdb. Some of these DMV can offer broad data on CPU, I/O and memory usage for corroboration with data from PerfMon (some DMVs actually expose PerfMon data). Others can offer deeper insight into the workload distribution across an instance and into databases or specific tables that hog I/O, or are the source of long running queries, and so on.
It is well beyond the scope of this article to summarize the breadth and depth of information you may wish to monitor, so I’ll just summarize a few important areas. The free eBook, Performance Tuning with SQL Server Dynamic Management Views, give a very nice broad overview of the DMVs and a nice, practical tutorial on how to use them.
Wait Statistics
Every time a session has to wait for some reason before the requested work can continue, SQL Server records the length of time waited, and the resource on which the session is waiting. These are the wait statistics, and SQL Server exposes them primarily through two Dynamic Management Views:
sys.dm_os_wait_stats(orsys.dm_db_wait_statson Windows Azure SQL Database) – aggregated wait statistics for all wait typessys.dm_os_waiting_tasks– wait statistics for currently-executing requests that are experiencing resource waits
The basis of performance tuning SQL Server using wait statistics is to interrogate these statistics to find out the primary reasons why requests are being forced to wait, and focus our tuning efforts on relieving those bottlenecks.
These DMVs are often a good first-port-of-call when examining a poorly performing system about which you know relatively little. However, you’ll usually need to corroborate your findings with other data.
Jonathan Kehayias’s book, Troubleshooting SQL Server: A guide for the Accidental DBA, offers an excellent overview of some of the most significant wait types and their meaning.
Virtual File Statistics
SQL Server exposes virtual file statistics through the sys.dm_io_virtual_file_stats function which, when passed a file_id(and database_id) reveals cumulative physical I/O statistics, showing IO operations per data and log file for the SQL Server instance, and the ratio of reads to writes. It is always worth checking this data if, after examining wait statistics and/or PerfMon data, you suspect a disk I/O problem. This DMV will reveal any “hotspots”, associated with high-latency read and write operations
See, for example: How to examine IO subsystem latencies from within SQL Server
Slow/Expensive Queries
SQL Server tracks the accumulated execution information for each of the plans that is stored inside of the plan cache, up to the point the plan is flushed from cache (e.g. due to DDL operations, memory pressure, or general cache maintenance. The sys.dm_exec_query_stats DMV exposes the execution information stored inside of the plan cache and we can mine it to expose expensive queries. Furthermore, we can CROSS APPLY the sys.dm_exec_query_plan function, using the plan_handle column from the sys.dm_exec_query_stats DMV to get the execution plan from queries that are causing problems.
See, for example, Chapter 3 of the book Performance Tuning with SQL Server Dynamic Management Views, (eBook, free for Simple-Talk members).
Indexing
Having the “proper” set of indexes in place and one that requires sound knowledge of database design, the distribution of the within the tables, and typical query patterns within the workload. It is a delicate balance between too many and too few indexes. The indexing DMOs, all of which have names starting with sys.dm_db_, can help the DBA identify:
- Unused or rarely used indexes (
index_usage_stats) - Usage pattern for existing indexes (
index_operational_stats) - Missing indexes (
missing_index_details,missing_index_group_stats)
See, for example: http://www.sqlskills.com/blogs/kimberly/the-accidental-dba-day-20-of-30-are-your-indexing-strategies-working-aka-indexing-dmvs/.
Example: Analyzing Multiple Resource Metrics with SQL Monitor
The SQL Monitor tool, under the covers, captures most of the Perfmon counters discussed previously, and mines various DMVs and exposes them through a relevant metric. For what’s missing, we can define our own custom metrics (see later).
I won’t cover these basic metrics, but instead refer you to the article, SQL Server Performance Troubleshooting with SQL Monitor 4, which offers good coverage of the data the tool collects and reports. Instead, I’ll offer a brief example that demonstrates the value of this sort of tool in allowing easy analysis of multiple metrics, over the same period.
As discussed earlier, it is rarely possible to diagnose a SQL Server performance problem from a single metric. It’s when we have a means to compare various metrics over the same timeframe that diagnostic analysis becomes much simpler.
In this particular example, the DBA receives complaints from users that reports were running slow for about an hour but seem to be back to normal now. The DBA investigates and immediately notices a big spike in machine processor time over period where reports were apparently slow. On the Analysis tab of SQL Monitor, we can load onto a single graph multiple metrics, over an adjustable period. By overlaying the data for the SQL Server processor time and SQL Server Batch requests/sec, the problem becomes clear immediately. Some process running on the server caused a close-to-100% spike in machine processor use, starved SQL Server of CPU cycles and led to the corresponding drop in the number of user requests it could process per second.
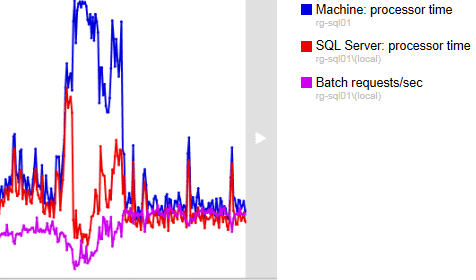
Figure 1: Multiple metric analysis with SQL Monitor
The DBA notes from the graph the time range for the CPU spike, then switches to the Overview tab and uses the “Rewind Time” feature to view the top-level metrics for the server during that time. Immediately, it’s clear that the CPU is at 100% and that the culprit is a non-scheduled backup process, which, as it turns out, a junior DBA ran, on request for a refresh of the development environment.

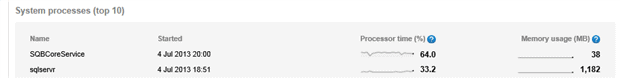
Figure 2: Rewinding time in SQL Monitor
Step 6: Specific Errors and Problems
In most environments, you’ll want to extend a base set of resource alerts to monitor for specific problems, and other conditions that may be environment-specific. For example:
- Blocked processes – blocking is normal, extended blocking is the problem
- Deadlocks
- Expensive/Long running queries (plus longer running than usual) – with the query text and affected database object
- Index problems – indexes disabled or highly fragmented
- High severity errors, such as those relating to database corruption
- Connections timeouts
We can write scripts to mine the required metrics from the DMVs, as described previously, as well as from various Perfmon counters, such as:
SQLServer:GeneralStatistics\Processes BlockedSQLServer:GeneralStatistics\User ConnectionsSQLServer:Locks\Lock Waits/secSQLServer:Locks\Lock Wait Time (ms)
To demonstrate the monitoring of these acute conditions and the sort of information you can expect from your alerts, we will look at just two examples, monitoring for deadlocks, and monitoring for database modifications.
Example: Monitoring Deadlocks with SQL Monitor
The Description tab for the SQL Deadlock alert, in SQL Monitor, provides some useful background information on deadlocks. However, for more in-depth coverage, I can recommend the Handling Deadlocks chapter of the book Troubleshooting SQL Server, by Jonathan Kehayias.
With his permission, I am going to reuse his bookmark lookup deadlock demo, from the chapter, and show how SQL Monitor detects and informs of this problem, and helps us diagnose and prevent future recurrence. You may find it interesting to compare the information provided by SQL Monitor, with that obtained from use of Trace Flag 1222 and SQL Trace’s Deadlock Graph event (or using the system_health default event session in Extended Events).
The code download package for this article contains the relevant scripts. If you want to simulate “blind” troubleshooting (i.e. without knowing in advance the exact cause), simply run script 1 (Bookmark Lookup Setup), followed by script 3 (Bookmark Lookup Select), followed by script 4 (Bookmark Lookup Update). Upon running the final script, you should receive an error message for the session running script 3:
Msg 1205, Level 13, State 51, Procedure BookmarkLookupSelect, Line 3 Transaction (Process ID 59) was deadlocked on lock resources with another process and has been chosen as the deadlock victim. Rerun the transaction. |
From the message, it is clear that a deadlock occurred and that SQL Server chose the call to the BookmarkLookupSelect stored procedure as the deadlock victim.
SQL Monitor provides a deadlock alert as a standard, base alert, so let’s see what it reports. There are two alerts raised on the target SQL Server instance, a Long-running query alert and a Deadlock alert. SQL Monitor raised the former because I left Script 3 running for a period, before running Script 4 to induce the deadlock. The Long-running query alert reveals the target database for the long-running query, the process name and ID, the time and duration of the query and the query text.
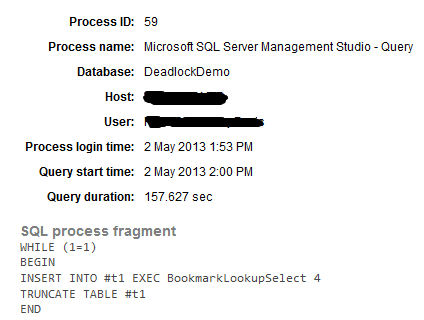
Figure 3: Long-running query alert
Figure 4 shows the Details screen for the Deadlock alert.
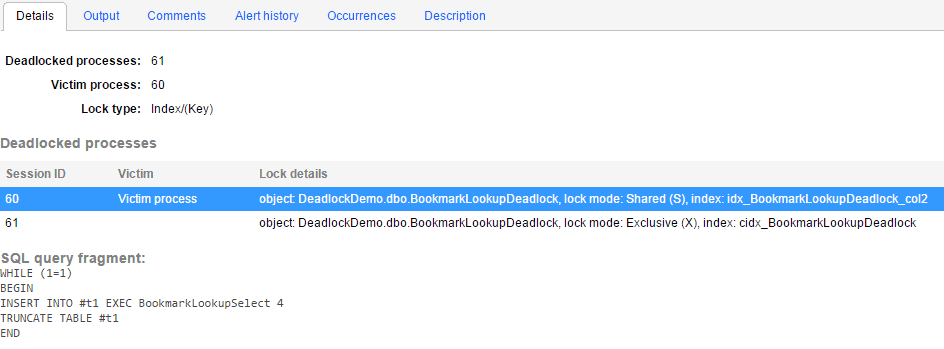
Figure 4: The Deadlock alert
We can see that processes 60 and 61 were engaged in a deadlock and that SQL Server chose process 60, the call to BookMarkLookupSelect stored procedure, as the victim and rolled it back.
The Output tab revealed the exact line of the stored procedure that session 60 was executing when the deadlock occurred:
SELECT col2 , col3 FROM BookmarkLookupDeadlock WHERE col2 BETWEEN @col2 AND @col2 + 1 |
Likewise, we can retrieve the exact UPDATE command for process 61, within the BookMarkLookupUpdate stored procedure.

In this fashion, we can work out that:
- Process 60 holds a lock on the index
idx_BookmarkLookupDeadlock_col2(a non-clustered index oncol2) – since this is aSELECTstatement, it will be a Shared (S) lock. - Process 61 holds a lock on the index
cidx_BookmarkLookupDeadlock(a clustered index oncol1) – since this is aUPDATEstatement, it will be an Exclusive (X) lock
Process 61’s UPDATE statement needs to modify col2, so needs an exclusive lock on necessary rows or pages in the non-clustered index, but cannot get one since process 60 has a shared lock on them, and so it cannot proceed. In turn, Process 60’s SELECT statement needs to access col3, which is not included in the non-clustered index, so needs to perform a bookmark lookup on the clustered index, for which it needs a S lock on the appropriate rows or pages, but can’t acquire it because of Process 61’s X lock; hence, a deadlock.
In order to avoid further deadlocks on this table, we need to identify the root cause. In this case, it is the bookmark lookup required to retrieve col3 data, and we can remove this simply by including col3 in the non-clustered index, ideally as a key but alternatively as an INCLUDE column (or create another one on Col3, if required). Having done so, we can rerun the bookmark lookup deadlock demo, and there will be no deadlock.
Generally, the first port-of-call on encountering any deadlock is to examine the queries involved and look for opportunities to tune them, or add helpful indexes. The primary cases of deadlocks is poorly designed queries that scan the data more than is necessary and hold locks longer than necessary. For further details on troubleshooting deadlocks, and diagnostic advice, I recommend Deadlock Troubleshooting, Part 1.
Example: Monitoring Database Modifications using a Custom Metric
As the needs arise, we can add our own custom metrics and alerts using T-SQL and Dynamic Management Views, or stored procedures (see, for example, http://sqlmonitormetrics.red-gate.com/). An obvious use for a custom metric is to monitor the number of current business processes. This will allow you to check database load against the actual work against resource use.
It is difficult to illustrate this sort of metric since it is entirely dependent on the application. Here, instead, is a simple custom metric that counts the number of database schema modifications, including object creations and deletions. In this case, we are using it to gauge the level of tempDB activity, but you can modify it very easily to check just for particular databases. Production systems do not allow any such modifications, generally, so this provides a check for intrusions.
SELECT COUNT(*) AS ObjectChanges FROM dbo.fn_trace_gettable(( SELECT REVERSE(SUBSTRING(REVERSE(path), CHARINDEX('\', REVERSE(path)), 256)) + 'log.trc' FROM sys.traces WHERE is_default = 1 ), DEFAULT) T JOIN sys.trace_events TE ON T.EventClass = TE.trace_event_id WHERE StartTime > DATEADD(mi, -5, GETDATE()) AND TE.name IN ( 'Object:Deleted', 'Object:Created', 'Object:Altered' ) AND DatabaseName = 'tempdb'; |
Step 7: Tune the monitoring strategy
Here, you are essentially tuning your reaction time. If you are receiving so many alerts, including duplicates, false alarms and so on that you are overwhelmed, then your response time will be slow, despite your monitoring. The first challenge is to reduce false alarms coming from your monitoring system. Reconfiguring your monitoring system can be a constant challenge, especially if a different group in the company controls the monitoring systems. A few approaches that might help:
- Don’t be afraid to temporarily suspend an alert if it’s causing an unacceptable deluge of mail; check to see if your tool allows you to respond to alerts by email, so the system knows you got the alert, are working on the issue, and don’t need to receive 200 similar alerts in the meantime.
- Distinguish between things you need to be told about once and things you need to be told about at every occurrence.
Attaining the right coverage will take time, as well as testing, but ultimately, these alerts are helping you find and fix issues, some of which you never even knew you had. However, as you learn the patterns of your servers’ activity, refine your alerting, fix false alerts, and tweak escalation profiles, the pain will abate.
Step 8: Measure the Effect of your Actions
The whole point of all this effort is to be able to spot problems as quickly as possible, and respond to them before the affect too many people and avoid certain problems by predicting when they are likely to occur and taking evasive action.
Your overall goal is to troubleshoot the issues you discover and so improve the performance of the servers and the applications that use them, and to start to see a downward trend in the number of alerts raised. Use the tool’s trend reporting and if you’ve been diligent in fixing issues and are seeing improvements across the board, don’t be shy in sharing this information.


0 comments:
Post a Comment
Note: only a member of this blog may post a comment.