In this we will discuss how to capture deadlock graph using SQL profiler.
To capture deadlock graph, all you need to do is add Deadlock graph event to the trace in SQL profiler.
Here are the steps :
1. Open SQL Profiler
2. Click File - New Trace. Provide the credentials and connect to the server
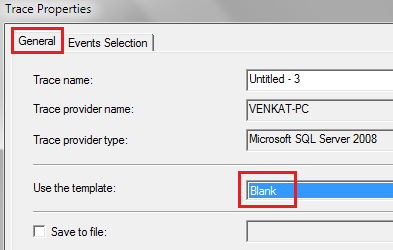
3. On the general tab, select "Blank" template from "Use the template" dropdownlist

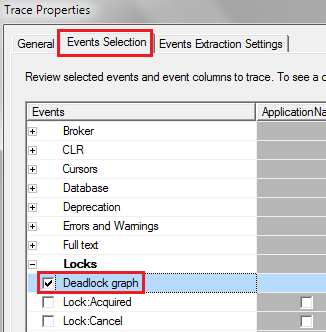
4. On the "Events Selection" tab, expand "Locks" section and select "Deadlock graph" event

5. Finally click the Run button to start the trace
6. At this point execute the code that causes deadlock
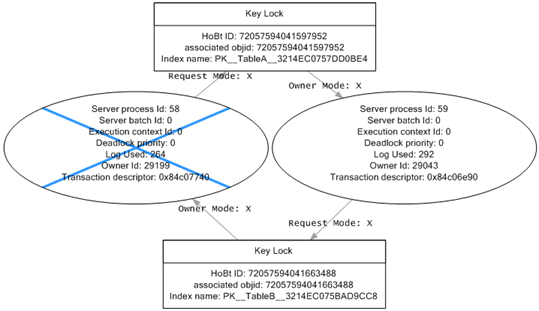
7. The deadlock graph should be captured in the profiler as shown below.

The deadlock graph data is captured in XML format. If you want to extract this XML data to a physical file for later analysis, you can do so by following the steps below.
1. In SQL profiler, click on "File - Export - Extract SQL Server Events - Extract Deadlock Events"
2. Provide a name for the file
3. The extension for the deadlock xml file is .xdl
4. Finally choose if you want to export all events in a single file or each event in a separate file
The deadlock information in the XML file is similar to what we have captured using the trace flag 1222.
Analyzing the deadlock graph
1. The oval on the graph, with the blue cross, represents the transaction that was chosen as the deadlock victim by SQL Server.
2. The oval on the graph represents the transaction that completed successfully.
3. When you move the mouse pointer over the oval, you can see the SQL code that was running that caused the deadlock.
4. The oval symbols represent the process nodes
- Server Process Id : If you are using SQL Server Management Studio you can see the server process id on information bar at the bottom.
- Deadlock Priority : If you have not set DEADLOCK PRIORITY explicitly using SET DEADLOCK PRIORITY statement, then both the processes should have the same default deadlock priority NORMAL (0).
- Log Used : The transaction log space used. If a transaction has used a lot of log space then the cost to roll it back is also more. So the transaction that has used the least log space is killed and rolled back.
- HoBt ID : Heap Or Binary Tree ID. Using this ID query sys.partitions view to find the database objects involved in the deadlock.SELECT object_name([object_id])FROM sys.partitionsWHERE hobt_id = 72057594041663488


.png)
0 comments:
Post a Comment
Note: only a member of this blog may post a comment.